Talk write-up: "How to build a PaaS for 1500 engineers"
This article is based on a presentation I gave as part of AdevintaTalks in Barcelona on November 2019. I’m experimenting with this format: I went through the slides typing what I’d speak over them, edited the text, and added some of the most relevant slides inbetween paragraphs. Let me know how it works.
–
Today’s topic is about Technical Infrastructure, a term I found first in a great talk by Will Larson. He defines Technical Infrastructure as “the software and systems to create, evolve, and operate our businesses.” That includes Cloud services, build tools, compilers, editors, source control systems, data infrastructure (Kafka, Hadoop, Airflow…), routing and messaging systems (Envoy, gRPC, Thrift…), Chef, Consul, Puppet, Terraform, and so on.
Companies that reach a certain size typically create one or more teams that take care of different subsets of those tools. They get named something like “infrastructure”, “platform”, “foundations”… I will use “Platform team” in this text.
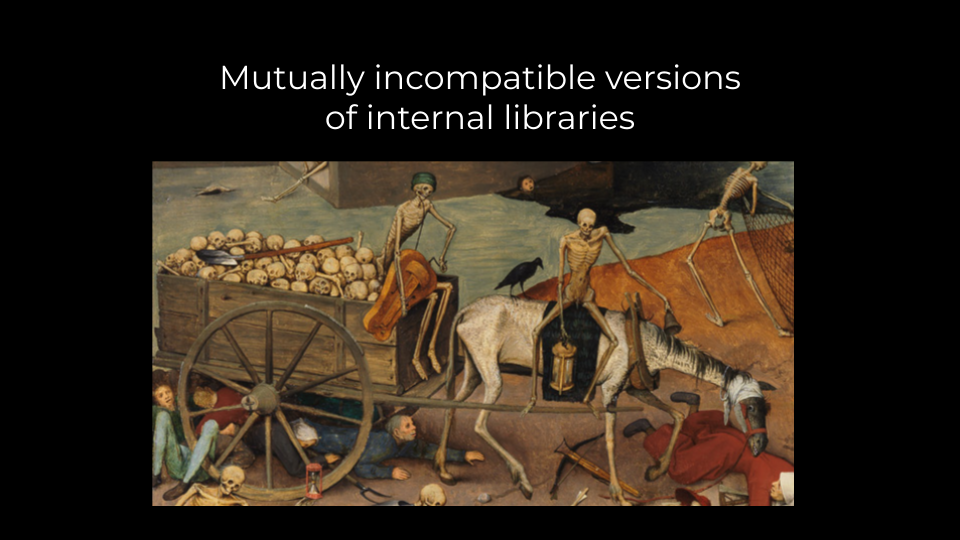
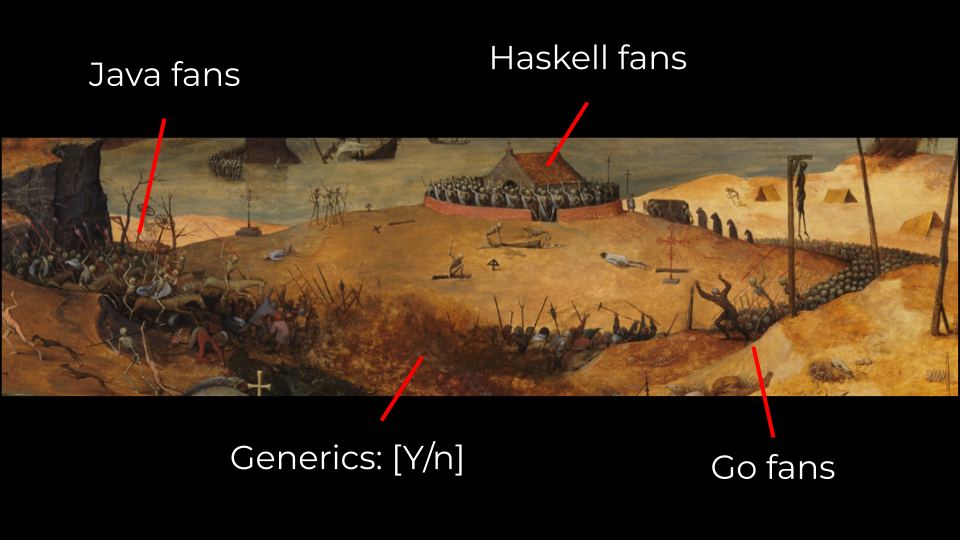
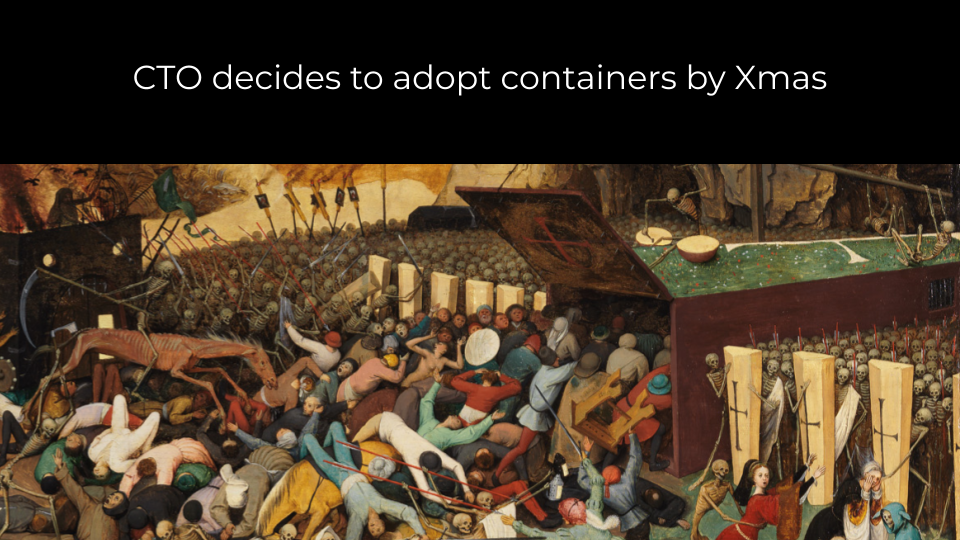
If you have been part of one, you will know that life for a Platform team is tough. I could find an actual picture that shows one of them on the field:
 Pieter Brueghel the Elder - "The Triumph of Death" (1562)
A good deal of the job is ultimately about finding the right balances between standardization and autonomy. To make meaningful impact, Platform teams depend on having standards in their organization. Trying to too support every possible language ecosystem, framework, DB, messaging system, and whatnot spreads Platforms teams too thin to be effective.
On the other hand, it is also wise to respect every other team’s autonomy to make their own technical decisions. Oppinionated Platform teams risk coming across as a patronizing, ivory-tower-dwelling jerks that impose capricious choices on other engineering teams. Standardization and autonomy are complex factors to juggle.
What if you multiplied this problem by 20? What if you had 20 companies to support, each with their own cocktail of technologies, cultures, philias and phobias, genealogies of decisions… and their own Platform team!
That’s my team’s job at Adevinta. Adevinta builds online marketplaces. Each of them are and need to be special in their own way. At the same time, they all share many other bits and pieces that don’t need to be different. That are, in fact, more cost-effective if they are built once and shared by all. Much of this falls in the category of Technical Infrastructure. My team works on that type of plumbing.
Generating value as a Platform team
You know who these people are?
They are the way fiction represents a profit centre. Those are parts of a company that bring money in, they generate revenue.
You know who these other people are?
They don’t smell of money, right? Fiction represents them in this way because they belong to a cost centre. They pay AWS bills, buy computers. In other words, money exits the company through them.
Profit centres tend to have a crisp value proposition that is easy to see and understand. It’s the opposite for cost centres. This doesn’t mean that they give no value to the company. On the contrary: that Kubernetes cluster is critical for the business. What is hard is explaining to the people in the first picture why the engineering team should spend cycles migrating from EC2 to Kubernetes instead of just shipping more money-generating features.
In a way, cost centres are valuable to the extent that they power-up the profit centres. This is why Platform teams should be aware that they live under constant scrutiny, visible or not. The business will always wonder, why are we paying this team of expensive engineers? Can’t Amazon, or Google, or Microsoft, or Digital Ocean, or Heroku, or whoever else, provide whatever these people do? Can’t we make use of those many open source projects funded by dozens of commercial companies, and use the headcount elsewhere?
In 2020, Technical Infrastructure is a hot market. While I gave this talk, Amazon was running Re:Invent in Las Vegas. The first day they announced Quantum computing as a service. They continued for an entire week running presentations that felt like..
So when a Platform team comes with their quarterly demo the perception is hopelessly.. small.
And those internal demos are great, don’t get me wrong, a lot of effort
and that. But when a Platform team is (intentionally or not) building
systems that have 3rd party alternatives they are competing in an uneven
playing field. A Platform team should really avoid competing against
AWS, Google, or any commercial company. It doesn’t matter if their
homegrown CI system is superior, today, to $commercial_ci_system. The
market will catch up, faster than expected, and make that team
redundant. Every Platform team should be asking themselves: what is our
differentiator? What do we offer than makes it worthwhile for our
company to invest in our team, rather than throwing those engineers
at the product?
To recap so far: because Platform teams are cost centers, they must really focus on formulating a clear and realistic value proposition that is relevant to the business. They must also ensure that their impact is intelligible to the business, and visible. Finally, they must ensure that those properties remain within a fast-moving industry.
Our PaaS
My team focuses on a PaaS that helps engineers across Adevinta build, deploy and operate software in the cloud. We focus mainly on stateless workloads (e.g. microservices.)
Our pitch for product engineers is simple: “look, we know you’re fighting in a competitive market. Our mission is to help you win that competition. You prefer to do the plumbing yourself? It’s your call, we respect that. But if you prefer to focus your attention on your product we have a team of domain experts that do the heavy lifing for you. We take care of providing you with the technical infrastructure that you need so you can focus on winning races”.
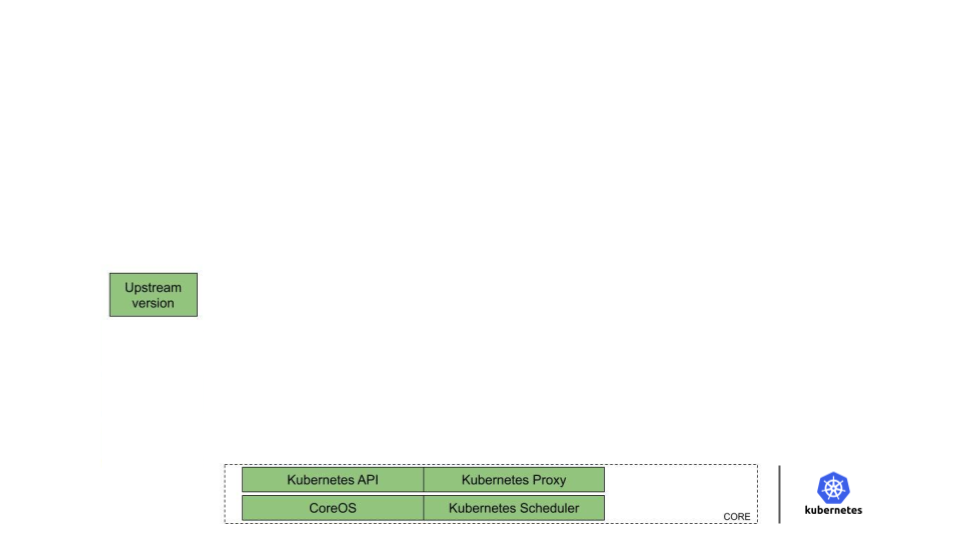
We define a Golden Path: a reduced set of sane, proven choices of tools that are effective to build, deploy, and operate microservices (the core systems we support are in the left-hand side slide below). Is each tool the best in their category? Probably not. But we know they get the job done, are well supported, maintained, and standardised in the industry. It’s not about local optimums, but global maximums.
It also not about chosing a bunch of random pieces and give product teams an Ikea-like platform that they must assemble piece by piece.
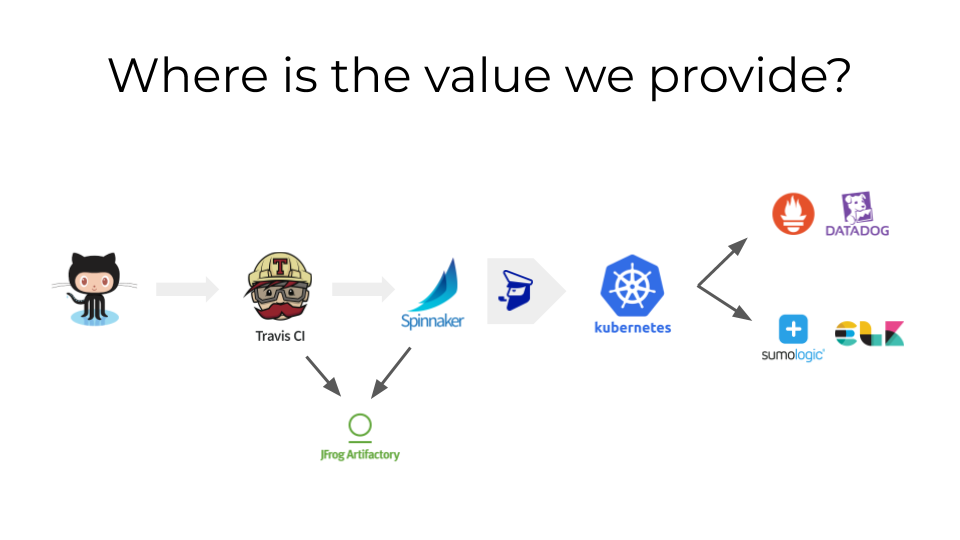
 We bundle GitHub, Travis, Artifactory, Spinnaker, FIAAS, Kubernetes,
Prometheus, Datadog, Sumologic, ELK.
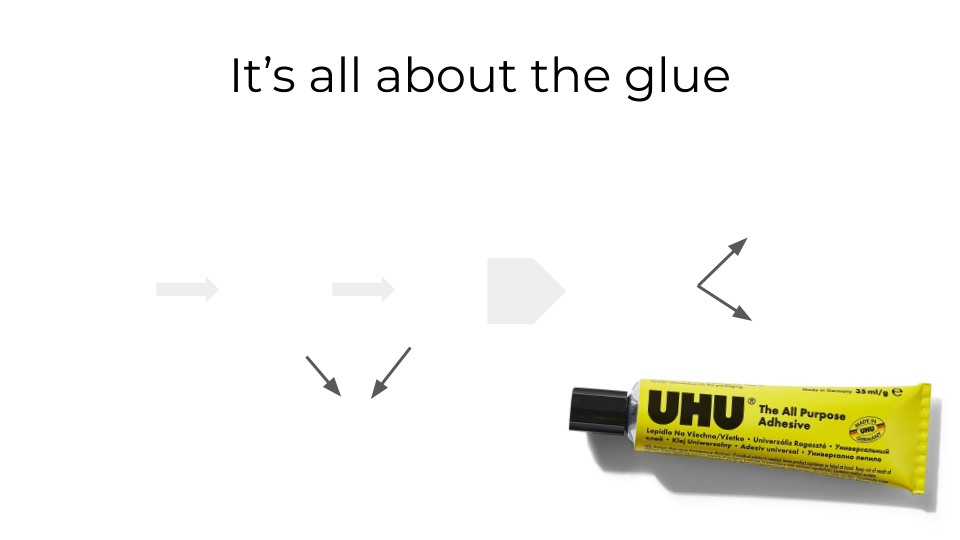
The main value we provide is in the joints, the articulation, the glue. In how we integrate together all these systems. Our PaaS favours composition of multiple modular components, trying to become a pierceable abstraction. The main benefits are:
- Avoid losing battles with commercial companies. Each of our components has at least one whole company behind it. It’s hardly realistic to expect that we can dedicate 5-7 of our engineers (1/4th of the team!) to build in-house alternatives to a CI system, a CD system, a metrics platform, etc. against businesses that have 20 or 50 times that capacity. Instead, we focus on what is specific for our company, tailoring off-the-shelf solutions to our needs. Commercial competitors are more likely to focus on what’s generic to larger portions of the industry.
- Well defined articulations become escape hatches for those teams that can’t or won’t use the entire bundle. This is a requirement to be able to support a highly heterogeneous population of companies and teams as we do. But it’s also good for us as it increases adoption, and creates low-friction “gateway drugs” to the full PaaS. We often see how teams that adopt one tool gradually adopt more organically as they gain trust and realize we can relieve them from doing a lot of undifferentiated heavy lifting.
- The same flexibility enables us to replace individual pieces when it makes sense, causing minimal impact for the users. One of our current initiatives is to ensure that upgrading or switching any of those pieces is completely transparent to users.
Small impact, repeated many times
One of the strategies we use is to spot where we can introduce tools that generate small impact to a wide surface. This worked quite well applied to reducing toil on the development process.
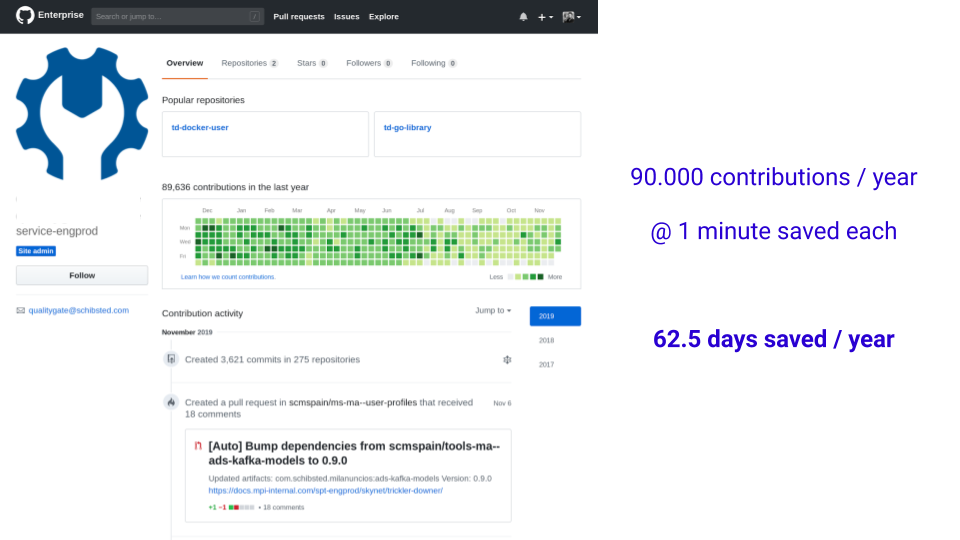
Of most of the tasks involved in getting a new change merged to the main tree, there may be only two that really need involving human brains: writing the code, and reviewing it. We set out to automate lots of the other small chores in the dev process: assigning reviewers, analyzing coverage and static analysis reports, propagating dependency updates, keeping branches up to date with their base, merging approved PRs… Each of these actions may have a tiny impact. But multiplied by a population of hundreds of engineers, month after month, you get economies of scale.
The image above is the profile for the service user that executes all these actions in our internal GitHub Enterprise instance. Assuming each action is worth 1 minute (many of them are actually more than that) it adds up to 62 engineer-days per year. That’s impact that can be very easily translated to money, to terms that the rest of the business can understand.
At this point you should have a siren wailing in your heads. “Wait, you said before that we should avoid competing with commercial companies. GitHub released Actions earlier this year, and some of the automation you just mentioned seems very similar to what is available in the public GitHub. Does that mean your team has just become obsolete?”
Remember the point about creating differentiators. The core
functionality that makes the PaaS (things like “running builds” or
“store these metrics and let me query them”, or “do $something when a
PR is created”) will become commoditized sooner or later. But glue is a
different story. Our differentiator here is simple: GitHub Actions can
only react to GitHub events. Our automation can react to events in the
entire Adevinta development ecosystem. All of it.
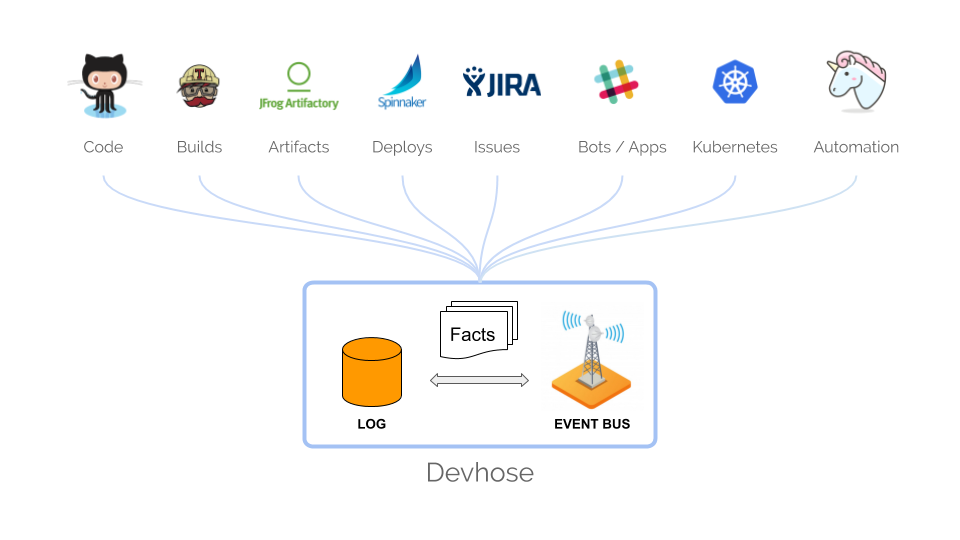
Because we didn’t spend that much time building the core tools, we could focus on the glue. The slide above shows Devhose, a component that collects events from every tool in our dev ecosystem (GitHub, Travis, Spinnaker, Artifactory, JIRA, Slack, Kubernetes… and even several tools outside of the Golden Path), stores them in a log, and broadcasts them in an “engineering event bus”. We also built some tooling around it that gives us the ability to easily implement new functionalities that interact back with the ecosystem. For example, one bot we prototyped recently listens to events in Kubernetes, detects killed pods, collects troubleshooting information and ships it to a Slack channel so the team that owns the service is alerted.
Thanks to having invested in glue, when GitHub Actions reaches the Enterprise version, it will bring value that we can leverage, rather than an existential threat.
Virtuous feedback loops
Having everything that happens in our dev ecosystem registered and broadcast in an event bus turned out to be valuable for multiple purposes. One of them was to build insights into the development process itself.
We built a system called Ledger to help with this. It is an event consumer that reads from Devhose’s event bus and crunches all types of productivity metrics. Which ones? One of our references is Accelerate and their annual “State of Devops” reports (2018, 2019). Their main claim is that the performance of software delivery teams can and does provide a competitive advantage to companies. This is backed by extensive industry research that links specific practises to the most effective and efficient ways to develop and deliver technology. This is precisely our team’s mission.
The authors identify four key metrics that capture the effectiveness of the dev & delivery process: Lead Time for Changes, Change Failure Rate, Deployment Frequency, and Time to Restore. These can be used as high level performance indicators that reliably gauge the ability of an organisation to achieve its goals.
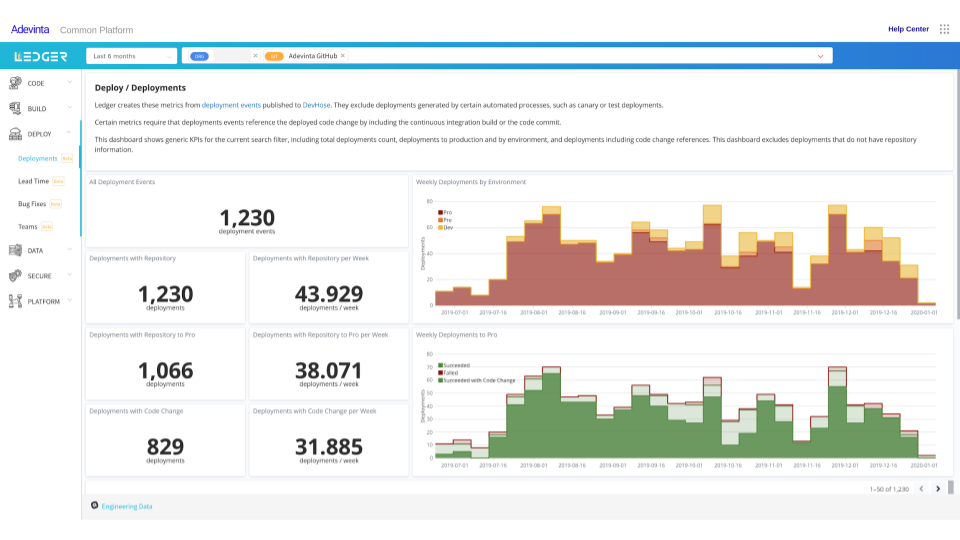
Because we provide the plumbing for most engineering processes, we are in the right place to measure them. Here is one of our dashboards about Continuous Delivery, including Deployment Frequency, one of the Accelerate indicators.
Teams that use our PaaS get these out of the box. Along with a lot more metrics. Build durations, code coverage, static analysis issues, security issues, lead time for changes, stats about the code review process, etc.
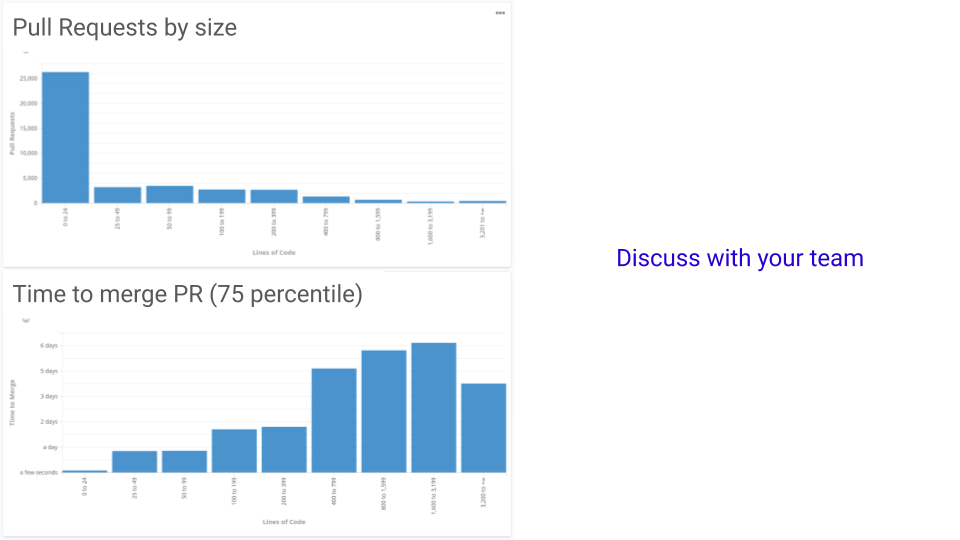
I have a certain liking to the Code tab, that shows the correlation between Pull Request size and time to merge in their team. Here is an example:
You have surely noticed at least two interesting details:
- It’s obvious that small PRs get merged faster. In fact, differences of just a couple dozen lines double the time to merge from hours to days.
- Even though time to merge grows with PR size, it looks like very large PRs (the last bucket) take a lot less to merge. You can guess why.
This example is a good way to show how Ledger helps us influence best
practises without confrontation, enforcement, or alienating engineers.
We bring no opinions to the table. We show over 2 years worth of data
that is contextualized for a whole team, a whole company, but never
exposes personally identifiable information. We care about how teams
perform, not how many points of code coverage are accountable to
$engineer. This is not a tool for managers to measure performance, but
for teams to understand and make informed decisions about their
processes.
Again, does this have some overlap with tools like SonarQube? Definitely. But we have differentiators. We can analyze everything in the dev process, not just code quality. We can tailor to the deploy and release workflows most common to our teams. We can enrich data with organisational information specific to Adevinta’s org chart. We can correlate quality with other phases in the process (e.g. the space we want to move into next is answering questions like “Does high code coverage correlate to less incidents?”). We can reprocess over 2 years of raw data on demand and generate new stats as we develop them (or fix bugs :).
The Accelerate report notes that these indicators can be used in two ways. Teams can inform improvements in their software delivery performance. Organisations can learn how to support engineering productivity with metrics that are intelligible to non-technical stakeholders. In other words, by providing these metrics, we facilitate a conversation between tech and business, between cost and profit centres. And precisely because we measure the productivity of teams, we can also measure in what degree our job delivers on our mission: support teams to deliver at their best.
Investing in a component
Sometimes we do invest in components of the Platform.
In the talk I didn’t have time to go over Spinnaker, where we’ve been (and remain) active contributors for ~4 years along with Netflix, Google, Target and many others. Being part of the community made it easier for us to upstream features that made sense for us, such as Cloud Formation support or integrations with Travis, as well as dozens of bug fixes and other improvements.
But the best example of in-house investments are the Kubernetes clusters we build and operate on EC2. The inevitable question is: why not use EKS, GKE, or other managed solutions?
The “glue” strategy should already come to mind.
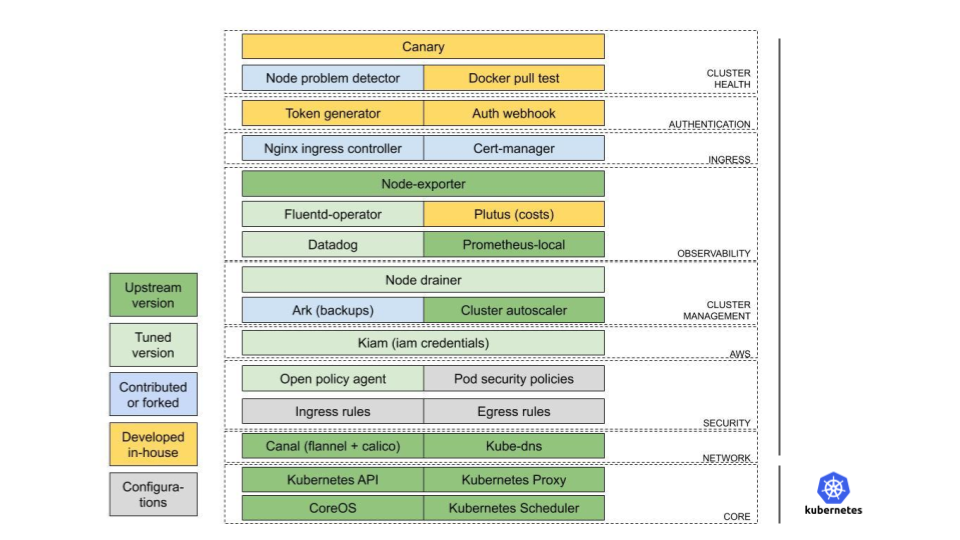
Below is a simplified comparison of what a raw installation of Kubernetes provides, and what our clusters provide. A bare Kubernetes cluster works, you can schedule containers, but that’s pretty much it. GKE, EKS, etc. provide slightly more than the left picture: they may autoscale nodes and handle other basic ops burden. But they are still far from covering the typical needs of product teams that wish to run production workloads securely, with little to no operational burden.
Some examples:
Our clusters are multi-tenant, allowing several marketplaces to share infrastructure securely while optimizing costs through higher density. We deal with all the cons of multitenancy. We handle network isolation for each tenant. We provide sensible defaults, pod security policies, etc. We added a validating webhook to the NGINX ingress controller that we contributed upstream, to reduce the blast radius of ingresses that break the NGINX configuration.
We maintain clusters in several geographical regions. This is instrumental for some of Adevinta’s central teams that build centralised functions like Messaging, Reputation systems, etc. that are meant to be used in several marketplaces that serve users in distant geographical locations (from Europe to Latin America). Our clusters offer a homogeneous, managed runtime environments, close to all Marketplaces, where central functions can be deployed.
In every cluster we provide integrations that work out of the box. You get automatic certificates leveraging cert-manager and Let’s Encrypt. Users can use authentication tokens generated through our company’s SSO. They get metrics automatically scraped and sent to Datadog or our internal Prometheus, as they chose with a simple config option. The same feature is provided for logs.
Users can avoid learning the full Kubernetes and use FIAAS, a commodity abstraction on top of Kubernetes. It was created in-house at one of our marketplaces ~7 years ago and was OSS’d in early 2019.
In every cluster we run automated canary tests periodically that deploy canonical applications and test connectivity and most integrations, we try to detect problems earlier than our users. Our team provides dedicated, 24/7/365 on-call.
We do full-stack aware upgrades. Because Google or AWS may upgrade your Kubernetes version, but will not care about the integrity of everything you’ve got running there. We upgrade at a slower pace than GKE/EKS, but when we do we ensure that the entire stack bundled in our cluster works, not just the core of Kubernetes.
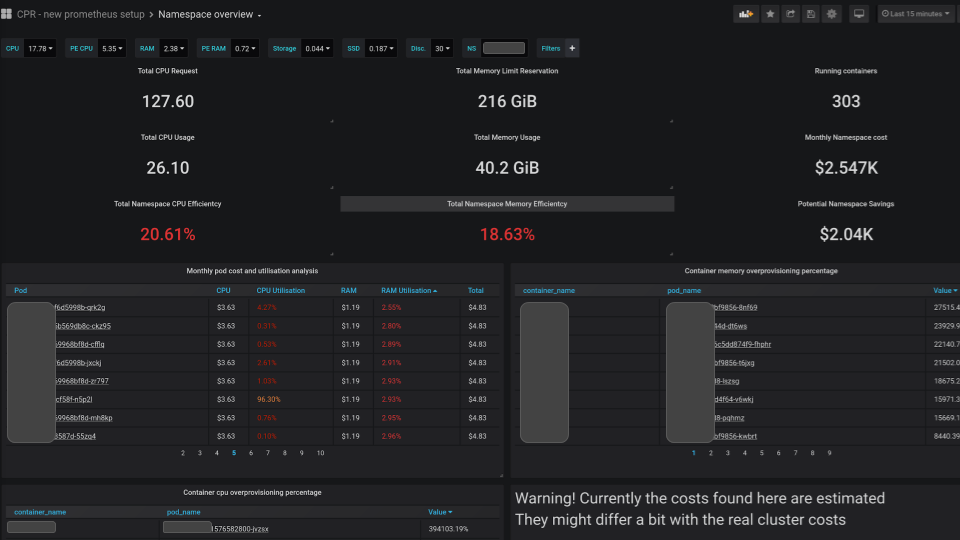
And we provide insights into your costs down to the pod level, informing users about potential savings if they are over-provisioning. Here is a PoC of a Grafana dashboard with this info:
I made a point before about creating articulations that facilitate pivoting to commercial choices once they become commoditized. That’s our strategy with EKS. We keep a close eye on its roadmap and have given feedback about our needs to AWS. As soon as EKS is a suitable base Kubernetes installation for us, we are ready to lift-and-shift our integrations on top.
Zero-friction onboarding
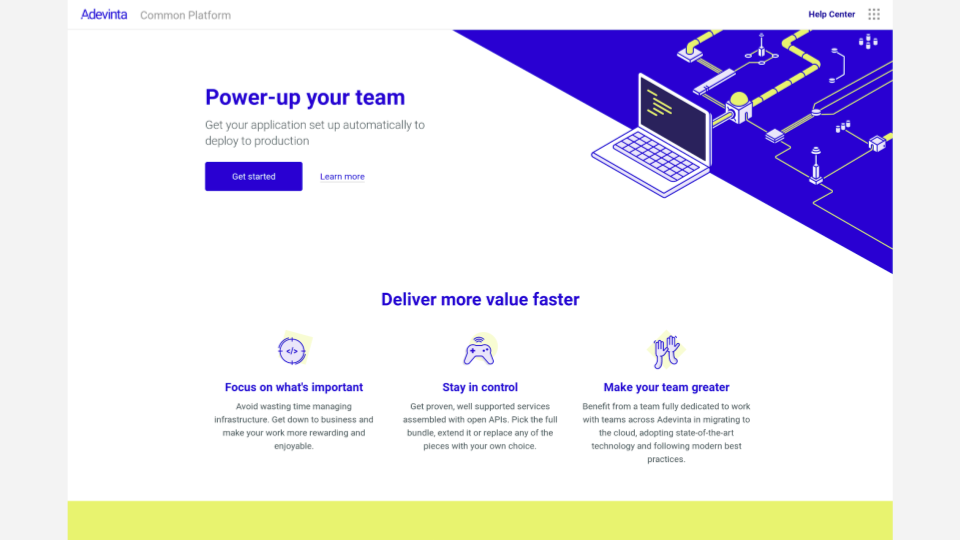
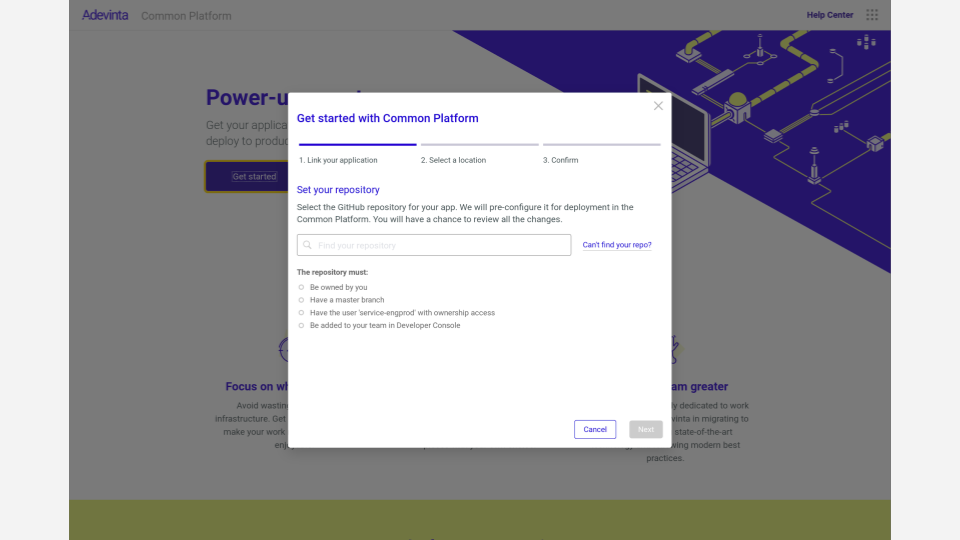
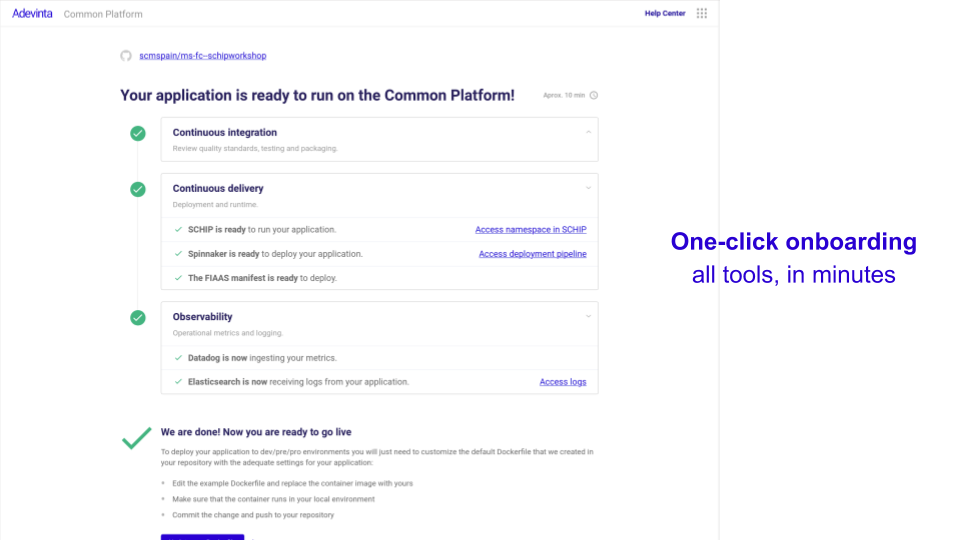
All this is (possibly) quite cool, but if engineers need weeks or months to start using it, nobody will. That was one of our top challenges a year ago. The core components in the PaaS were mostly there, but each team would have to spend days or weeks configuring each of them by hand on their repositories. Throughout the last year we’ve invested heavily in streamlining the onboarding process. We turned what was an Ikea-like experience into an almost seamless process. Users get a web interface, enter their repository URL, click on a button, and our automation takes it from there. It takes ~10 minutes for their repository to be automatically configured with CI/CD pipelines, deploying to their team’s private namespace, and integrated with metrics and logging systems. If something fails or manual action is required from our Platform teams, the onboarding tool notifies, keeps track of the issue in JIRA, and resumes the process when we’ve unblocked it.
There is a point about the importance of automation here, but I want to stress something else. If you buy the proposition that Platform teams have a significant degree of competing scope with commercial companies, UX spacialists are a must-have. A team big enough to serve hundreds of engineers must reserve headcount for a good UX designer. It will pay off. Not only will you stop inflicting backend-made-UIs to your engineers, but also because the Platform team will learn how to understand the needs of their users, test their assumptions (most of which will be wrong), the impact they make with their work, and deliver a more professional product.
The team in charge of those automation and UIs has been using instrumentation data collected in the onboarding process to polish the experience, improve the failure rate and cover corner cases. Last quarter they moved on to solving other pain points in the platform. For example, troubleshooting a failed deploy. Right after Christmas we plan to release a team dashboard with all applications maintained by a given team. It summarizes status for each, and highlights when something fails in the build, deployment pipelines, or runtime, with relevant information collected from any system in the PaaS. Again, glue.
Change hurts, we should feel it too
Regardless of the effort we put in to improving the onboarding experience for our users, at the end of the day we’re moving engineers from a known territory, their on-prem infra, EC2, or wherever they run their services today, to an unknown one. At some point, every migration feels like this.
 Théodore Géricault - The Raft of the Medusa. (1819)
When this happens, someone from our team should sail in that raft with them.
Specially for mid/large sized migration projects, we allocate at least 1-2 of our engineers to support teams on-site. To give an example, we now have an ongoing migration project for ~200 microservices from all the Spanish sites. For several months we’ve had engineers from our team, as well as the local Platform team inside Adevinta Spain sitting together in a shared seating area. Both share OKRs, regular plannings, weekly syncs, etc. In our previous engagement with the Subito.it team, three of our engineers travelled to Italy for several weeks during the quarter. We are also creating different workshops that we reuse and adapt for newly onboarded teams, including Kubernetes basics, hands-on exercises, etc.
There are two key outcomes to working closely to our users:
- Trust: engineers in the product teams stop perceiving those in the Platform teams as a Slack handle, but actual people with faces that they can confidently ask questions to. The local Platform teams in the marketplaces start seeing us as partners rather than an existential threat.
- Engineers in our Platform team learn the needs of product engineers, and gain experience on how it feels to use the tools we build. They also leverage the expertise of local Platform teams that have been working in this space for years in their respective marketplaces. While it’s hard to leave your team for weeks or months, the experience is an eye-opener and everyone brings invaluable insights back to our teams.
Is it working?
It’s a bumpy ride by nature, but yes. How do we measure it?
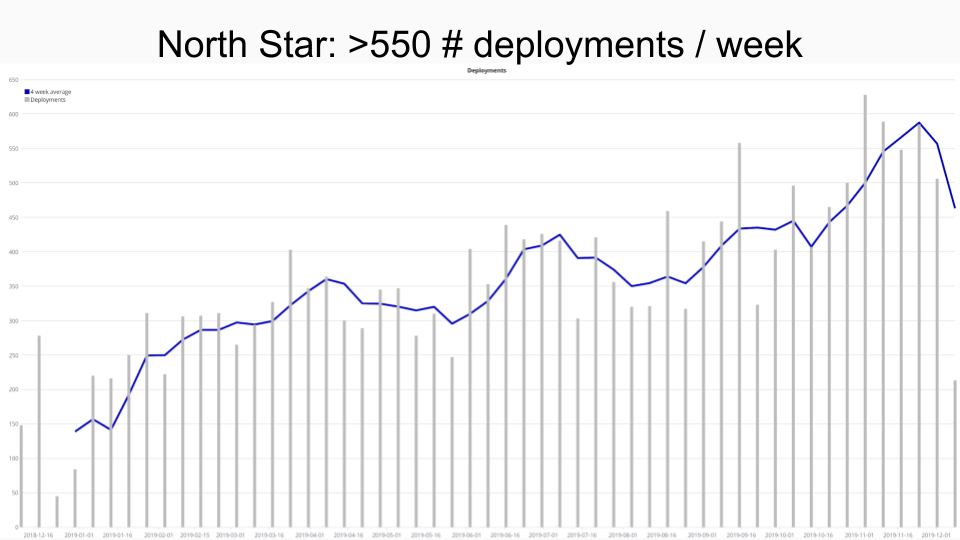
As I mentioned above, metrics like those proposed by Accelerate seemed relevant as they measure precisely the properties we wish to improve. After getting some help from a Itamar Gilad, a professional product management consultant, we settled for Successful Deployments per week as our North Star.
We believe it is a good proxy for productive habits that we want to incentivise: deployments are easy and automated, work reaches users early, and defects can be repaired quickly. For us, more frequent deployments have two positive implications: more services use our PaaS, and those that use it behave productively by deploying more often. We only count “Successful” deployments to ensure that our tools help and incentivise pushing healthy code out.
Here is our North Star tracking dashboard for the past year (the dip at the right is just the last incomplete period.)
This quarter we’ve spent time collecting a whole set of other metrics that influence the North Star (e.g. number of active repos, build durations, etc.) and are fundamental to defining good OKRs.
Harder to quantify, but easier to appreciate, is feedback from our users. A couple of days before the talk we found this in Twitter from an engineer in one of the Spanish marketplaces that were onboarding the Platform in those days.
 Translation: "The transition to Kubernetes is going so well that I'm
not feeling it. Basically everything works perfectly. Hat tip to everyone who
made it."
We have lots of rough edges and potential for improvement, but it feels we are in the right track. My +10 for that hat tip to all the excellent colleagues that have contributed to making this possible, from infrastructure to UX and everything inbetween.
More writing
- Inferencing delivery bottlenecks away Mar 2026
- Code reviews can't keep up Feb 2026
- AI workloads challenge the cattle model Feb 2026
- PoC is a framework of perverse incentives Jan 2026
- AI-generated code will choke delivery pipelines Apr 2025
- Why aren't we all serverless yet? Jan 2025
- See all →
